Nifty Weekly Forecast From Oct 10, 2011 - Asset Rotation Will Continue until we reach double dip (4747 - 5001)
Oct 07, 2011 - Nifty Closed today at 4888.05 which is 55 points down from the last week close of 4943.25 on Sep 30, 2011. Nifty was trading in between 4728.3 and 4922.6 which is about the swing of 194 points in a holiday shortend week.
To watch Nifty Index in google finance, visit the following link:
NSE Index in Google Finance
To watch Nifty Index in yahoo finance, visit the following link:
NSE Index in Yahoo Finance
Last Week Analysis - Bear Market Rally and Asset Rotation
Nifty lost ground in the begining of the week, it would be treated as a bear market rally and it is not a clear buy signal for conservative investors. Banks in US and Euro Zone anxiety triggered a sell off in late week. Even the 30 years are hitting a low point, there is no sign of improvements in defaults and forecloures as well as decling home prices.
Last Week Low: 4728.30 (Refer to the strong support level 4800, would be broken in the coming weeks)
Last Week High: 4922.60 (Strong resistance level build around 5100 range
Looking at the chart below clearly indicates the declining 200 days EMA and 50 days EMA. It means that market will tend to go lower in the long term with occasional bear market rally. In this market, buy and hold strategy would fail. We need to follow the key technical support levels and play with swing trading strategies. Swing trading involves high risks when range bound trading completely broken. Betting on volatility with negative bias would yield a lot in this market. Institutional investors are smartly exiting their long and short positions based on the market condition and keep switching their assets. When treasuries are reaching almost a top level, then institutional investors will exit from the treasuries and t-bills and switch back to undervalues banking and finance sector. This is the main cause of the rally in the last two trading sessions.
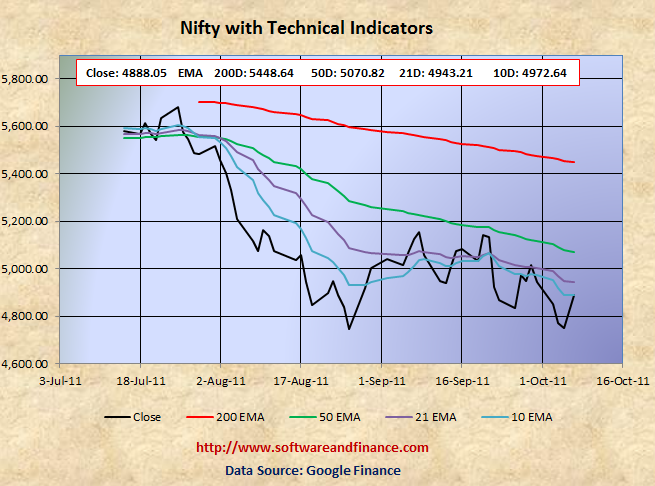
Nifty technical levels suggest betting on volatility as key support level to be broken in the coming weeks.
Long term investors can start taking long positions. If you are conservative and hold currency or indian T-Bills. The key resistance level for Nifty came down to 5100 and the key support level for Nifty is 4960, 4800 and 4747. As we retested this support level a couple of times, it is most likely the bears will control the market in the coming weeks to take it below 4747. The reason why it is not going below 4700 range is, the next support level is at 4003 set on Jul 10, 2009 which looks very scary.
However decling 200 days and 50 days EMA suggests that Nifty will break this support level and try to go below 4500 in the coming weeks. However it is not a good idea to short Nifty. It is a good idea to exit from long position and betting on volatility on Nifty by buying both call and put option at the same strike price.
Nifty might experience a double dip in Indian Market along with world market correction in the long term (about 2 years). With double dip, Nifty is expected to touch 2600 levels set on Oct 2008 and Mar 2009. Wait for some more time to get more clues on "double dip on Nifty"
For Speculators and Intraday Players - Betting on Volatility (Option Straddle / Strip)
1. Buy 1X times of (OTM) call options and 2X time of (OTM) put option - known as option strip.
2. Buy 1X time of call and 1X time of put option with the same strike price - known as option straddle.
Note: OTM - means Outside the money.
Technical Indicators
10 days EMA: 4887.67
21 days EMA: 4943.12
50 days EMA: 5070.82
200 days EMA: 5448.64
Next Resistance Levels:
Minor Resistance level at: 4943.12 - 21 days EMA
Strong Resistence level at: 5070.82 - 50 days EMA
Resistence level at: 5225.80 set on Feb 10, 2011 and Jun 20, 2011
Resistence level at: 5448.64 - 200 days EMA
Next Support Levels:
Minor support level at 4940.95 set on Sep 13, 2011
Strong support level at 4806.75 set on May 25, 2010
Strong support level at 4747.80 set on aUG 26, 2011
Strong support level at 4718.00 set on Feb 05, 2010
Strong support level at 4003.90 set on Jul 10, 2009
Strong support level at 2620.10 set on Mar 06, 2009 Will reach here with double dip
Strong support level at 2584.00 set on Oct 24, 2008 Will reach here with double dip
Posted on Oct 08, 2011
|
|