Nifty Weekly Forecast Starting August 22, 2011 - Time to START taking long positions
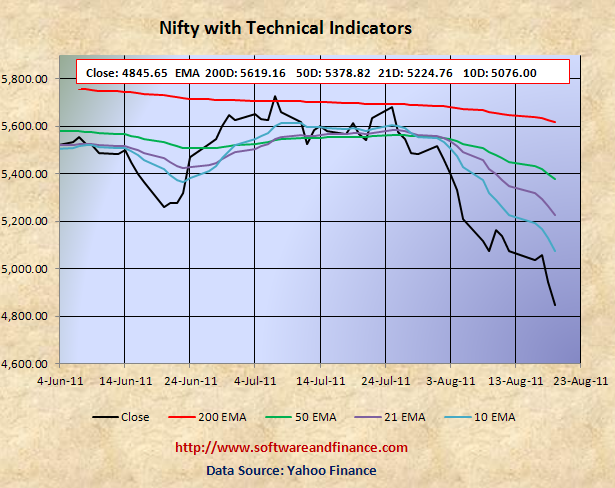
August 19, 2011 - Nifty Closed today at 4845.65 which is about 227 points down from the last week close of 5072.95 on August 12, 2011. Currently Nifty technical and support levels suggest to cover your short positions completely. You can start buying with the current levels with caution. Market always would like to see extreme, as investors should also be prepared for swings. If the market goes down further, you should be in a position to accumulate your long positions with ladders of orders.
To watch Nifty Index in google finance, visit the following link:
NSE Index in Google Finance
To watch Nifty Index in yahoo finance, visit the following link:
NSE Index in Yahoo Finance
Last Week Analysis
With reference to last week forecast, I have mentioned that "Nifty technical levels suggests one more retesting towards 4800 level before powerful rally" which came exactly true last eek. Last week low point is 4796.10.
Last Week Low: 4796.10 (Refer to the strong support level 4800)
Last Week High: 5132.20
Cover your short positions aggresively and start accumulating your long positions
A good news for long term investors is they can take about 30%-50% of their investments into stock positions by going long. But do not expect a return in the short term. Currently it is on oversold condition, a nice rally is more likely. Try investing in high dividend stocks. If the market goes down further, you can again buy gradually with your remaining cash position.
Night might experience a double dip in Indian Market along with world market correction in the long term (about 2 years). With double dip, Nifty is expected to touch 2600 levels set on Oct 2008 and Mar 2009. Wait for some more time to get more clues on "double dip on Nifty"
For Speculators and Intraday Players - Go long with Hedging (Option Strap)
Market is ready for powerful rally, but prepared to hedge your long positions
1. Long on the market and hedge using long put options - known as long position with put hedge.
2. Buy 1X times of put options and 2X time of call option - known as option strap.
Technical Indicators
10 days EMA: 5076.00
21 days EMA: 5224.76
50 days EMA: 5378.82
200 days EMA: 5619.16
Next Resistance Levels:
Resistence level at: 5225.80 set on Feb 10, 2011 and Jun 20, 2011
Resistence level at: 5224.76 - 21 days EMA
Resistence level at: 5378.82 - 50 days EMA
Resistence level at: 5619.16 - 200 days EMA
Next Support Levels:
Strong support level at 4806.75 set on May 25, 2010
Strong support level at 4718.00 set on Feb 05, 2010
Strong support level at 4003.90 set on Jul 10, 2009
Strong support level at 2620.10 set on Mar 06, 2009 Will reach here with double dip
Strong support level at 2584.00 set on Oct 24, 2008 Will reach here with double dip
Posted on August 20, 2011
|
|