Nifty Technical Forecast Weekly Starting July 11, 2011 - Sudden debacle is more likely in the market
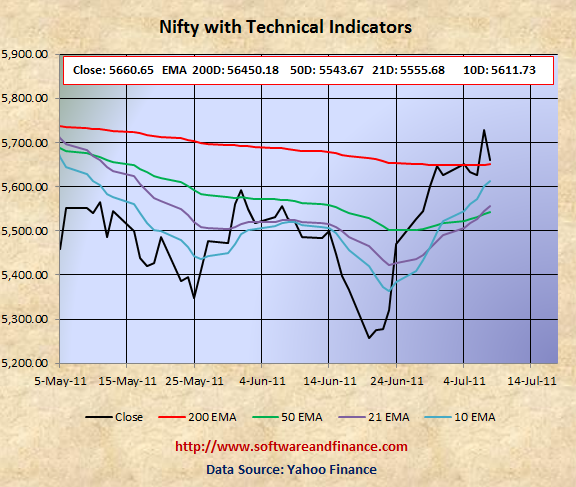
July 08, 2011 - Nifty Closed today at 5660.65 which is 33.45 points above from the last week close of 5,627.20 on July 01, 2011. Nifty strong technicals once again pushed index towards bull run. On Last Friday, Nifty had a swing of close to 90 points, but it went down with closing of 5660.65 with moderate weekly gains.
Once Nifty ragained its 200 days EMA, many knowledgable investors started closing their positions. Because the upside is very much limited and downside is huge.
Last week I have suggested to bet on market volatility. In bear market, often market will have powerful rally compared bull market. The last week rally and swing in either direction on Nifty confirms and gives reassurance of upcoming bear market.
To watch Nifty Index in google finance, visit the following link:
NSE Index in Google Finance
To watch Nifty Index in yahoo finance, visit the following link:
NSE Index in Yahoo Finance
Last Week Analysis
Look at the following chart. Nifty is testing its 200 days EMA once again. On last Thursday it went above 200 days EMA and it fall back to its support level 200 days EMA.
Nifty is touching on its 200 days EMA would be a perfect time to close your existing long positions. If the market goes up for a couple of sessions, then you can initiate short position and accumulate short position gradually in the coming weeks. You can not expect return in the short term. This stratgey is good for long term risk taking investors.
If you are a long term conservative investors, then you have to switch your investment strategy and move on the Fixed Income Securities - Govt. Bonds, Fixed Deposit, etc.
Nifty is good to STRONG BUY for conservative investors only it encounters a deep correction which I expect it to go all the way down to 4800 which was set on Feb and May 2010. There might be chance for double dip in Indian Market along with world market correction. With double dip, Nifty is expected to touch 2600 levels set on Oct 2008 and Mar 2009. Wait for some more time to get more clues on "double dip on Nifty"
For Speculators and Intraday Players
Nifty closed above 200 days EMA on Last Friday. If you look at only technicals and no fundamentals, In order to get bull indicators on Nifty 50 days EMA, 21 days EMA have to move higher beyond its level 200 days EMA. It would take at least two months in order to get that position.
Until the market will swing in either direction between its support level and resistance level. If you are an option player, you can consider executing butterfly options in this situation. Alternatively you can take long positions with put options for hedging. You can buy put options for long term for insurance and keep playing (buy and sell) the stocks on intraday or within a week time frame.
It is very risky to play in this market without hedging. Sudden debacle is more likely any time.
Technical Indicators
10 days EMA: 5611.73
21 days EMA: 5555.68
50 days EMA: 5543.67
200 days EMA: 5650.18
Next Resistance Levels:
Resistence level at: 5650.18 - 200 days EMA
Next Support Levels:
Strong support level at 5543.80 set by 50 days EMA
Minor support level at 5555.68 set by 21 days EMA.
Strong support level at 5225.80 set on Feb 10, 2011 and Jun 20, 2011
Strong support level at 4806.75 set on May 25, 2010
Strong support level at 4718.00 set on Feb 05, 2010
Strong support level at 4003.90 set on Jul 10, 2009
Strong support level at 2620.10 set on Mar 06, 2009 Will reach here with double dip
Strong support level at 2584.00 set on Oct 24, 2008 Will reach here with double dip
Posted on July 10, 2011
|
|