Nifty June 27, 2011 Nifty Enjoyed Bear Market Rally
June 27, 2011 - Nifty Closed on Last Friday (June 24) at 5471.25 which is up by 3.6% in the last two sessions (compared to June 22, 2011 Close of 5278.30).
With reference to my earlier update, I have suggested to bet on market volatility - "Only if you are day/short term trader, you can bet on the market with volatility. Meaning you have to bet on either direction because powerful short term rebound on Nifty is also likely even the technical levels are bearish."
To watch Nifty Index in google finance, visit the following link:
NSE Index in Google Finance
To watch Nifty Index in yahoo finance, visit the following link:
NSE Index in Yahoo Finance
Bear Market Rally On Friday - Another chance to accumulate short positions or exit the long positions
Nifty enjoyed a powerful bear market rally in the last two sessions. Loot at the following chart.
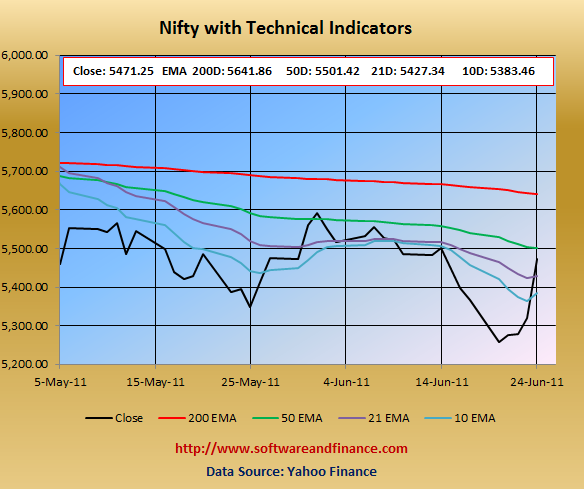
Nifty is just shy of 50 days EMA of 5501.42. I think this will act as a big resistance point in the coming weeks. With on going housing crisis, RBI interest rate hike and greece bailout, it is unlikely to retest 200 days EMA of 5641.86.
Only if you are day/short term trader, you can bet on the market with volatility preferably two times more on downside. It is called options strip, if you are familiar in options trading.
If you are a long term risky player in the market, then you can initiate short position and accumulate short position gradually in the coming weeks. You can not expect return in the short term.
If you are a long term conservative investors, then you have to switch your investment strategy and move on the Fixed Income Securities - Govt. Bonds, Fixed Deposit, etc.
Nifty is good to STRONG BUY for conservative investors only it encounters a deep correction which I expect it to go all the way down to 4800 which was set on Feb and May 2010. There might be chance for double dip in Indian Market along with world market correction. With double dip, Nifty is expected to touch 2600 levels set on Oct 2008 and Mar 2009. Wait for some more time to get more clues on "double dip on Nifty"
Technical Indicators
10 days EMA: 5383.46
21 days EMA: 5427.34
50 days EMA: 5501.42
200 days EMA: 5641.86
Next Resistance Levels:
Resistence level at: 5501.42 - 50 days EMA
Resistence level at: 5641.86 - 200 days EMA
Next Support Levels:
Strong support level at 5427.34 set by 21 days EMA.
Strong support level at 5225.80 set on Feb 10, 2011 and Jun 20, 2011
Strong support level at 4806.75 set on May 25, 2010
Strong support level at 4718.00 set on Feb 05, 2010
Strong support level at 4003.90 set on Jul 10, 2009
Strong support level at 2620.10 set on Mar 06, 2009 Will reach here with double dip
Strong support level at 2584.00 set on Oct 24, 2008 Will reach here with double dip
Posted on Jun 27, 2011
|
|