Nifty July 01, 2011 Nifty Tested its 200 days EMA, What Next?
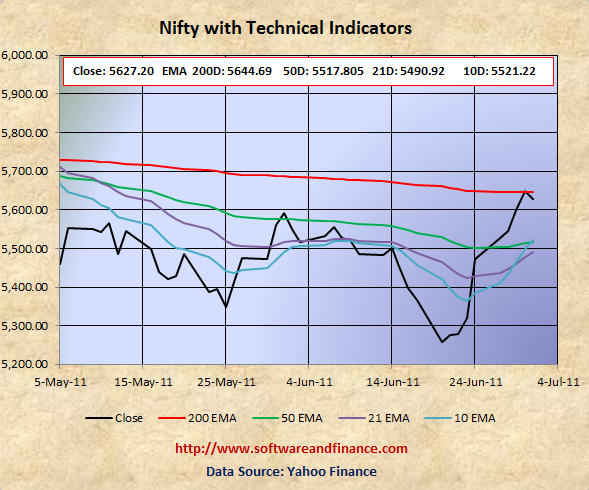
July 01, 2011 - Nifty Closed today at 5627.20 which is just 18 points below its 200 days EMA of 5644.69. Interestingly on Thursday June 30, 2011 Nifty closed at 5647.40 which is 3 points above its 200 days EMA and it triggered a strong bullish signal on Friday morning. That's why Market opened with a gap up and started trading at 5705.75. Eventually Nifty wants to confirm its testing of 200 days EMA once again before resumes its downtrend.
Once Nifty ragained its 200 days EMA, many knowledgable investors started closing their positions. Because the upside is very much limited and downside is huge.
With reference to my earlier update, I have suggested to bet on market volatility. In bear market, often market will have powerful rally compared bull market. The last week rally on Nifty confirms and gives reassurance of upcoming bear market.
To watch Nifty Index in google finance, visit the following link:
NSE Index in Google Finance
To watch Nifty Index in yahoo finance, visit the following link:
NSE Index in Yahoo Finance
Perfect Time to exit from the market
Nifty enjoyed a powerful bear market rally in the last week. Loot at the following chart. A spike in 10 days EMA (blue line on the chart) suggests that market correction is imminent.
Nifty is touching on its 200 days EMA would be a perfect time to close your existing long positions. If the market goes up for a couple of sessions, then you can initiate short position and accumulate short position gradually in the coming weeks. You can not expect return in the short term. This stratgey is good for long term risk taking investors.
If you are a long term conservative investors, then you have to switch your investment strategy and move on the Fixed Income Securities - Govt. Bonds, Fixed Deposit, etc.
Nifty is good to STRONG BUY for conservative investors only it encounters a deep correction which I expect it to go all the way down to 4800 which was set on Feb and May 2010. There might be chance for double dip in Indian Market along with world market correction. With double dip, Nifty is expected to touch 2600 levels set on Oct 2008 and Mar 2009. Wait for some more time to get more clues on "double dip on Nifty"
Technical Indicators
10 days EMA: 5521.22
21 days EMA: 5490.92
50 days EMA: 5517.80
200 days EMA: 5644.69
Next Resistance Levels:
Resistence level at: 5644.69 - 200 days EMA
Next Support Levels:
Strong support level at 5517.80 set by 50 days EMA
Minor support level at 5490.92 set by 21 days EMA.
Strong support level at 5225.80 set on Feb 10, 2011 and Jun 20, 2011
Strong support level at 4806.75 set on May 25, 2010
Strong support level at 4718.00 set on Feb 05, 2010
Strong support level at 4003.90 set on Jul 10, 2009
Strong support level at 2620.10 set on Mar 06, 2009 Will reach here with double dip
Strong support level at 2584.00 set on Oct 24, 2008 Will reach here with double dip
Posted on July 01, 2011
|
|