Economics - Home Price Forecast For 2013
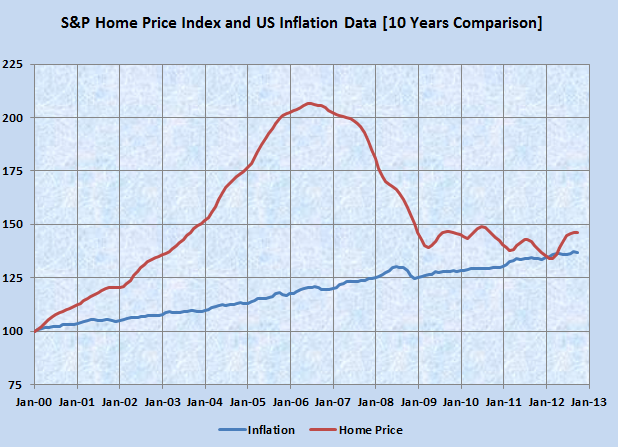
Dec 31, 2012 The following is the 10 years comparison chart between US inflation and S&P Home Price case shiller index. If you look at the 10 years comparison chart, you can see that around March 2012, US home prices have touched the S&P Home price case shiller index. Based on the 10 years comparison, we can see that US home prices have bottomed in March 2012.
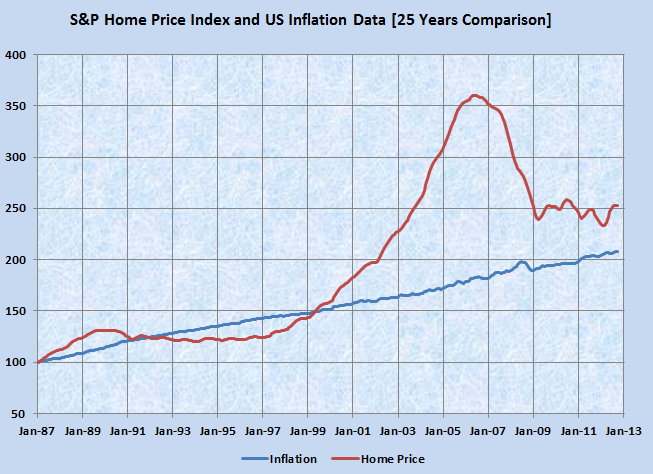
Here is the 25 years historical comparison chart for US inflation data versus S&P case Shiller index for Composite 10 cities Not seasonably adjusted data. When the home prices peaked in June 2006, home prices went up about 260% since Jan 1987 where as inflation went up only for 83%. The difference is between inflation and home price is about 177% which is huge.
When home prices have bottomed compared to 10 years inflation chart during March 2012, let's analyze how it looks in 25 years chart. In March 2012, home prices went up about 133% since Jan 1987 where as inflation went up for 106%. Now the home price is trading around 27% premium compared to inflation in 25 years chart. Since the current interest rate is very low, as of today, the 30 years mortgage interest rate is around 3.75%.
Since the interest rate has been very low for the last four years, it is a very good time to put your money into real estate.
Now the question is what happens when the interest rate goes in 2013? Currently the inflation is spiking up in US market and hence home prices likely to stay on the flat line even though the interest rate goes up. However increasing interest rate during 2013, will put a break on rising home prices but the home prices unlikely to decline from the current levels since the inflation could catch the home price on a faster pace in the last 6 years.
Data Sources:
http://www.federalreserve.gov/monetarypolicy/openmarket.htm
http://www.standardandpoors.com/indices/main/en/us
http://www.bls.gov